
Diversification Beyond Equities: Building Resilient Portfolios
Equity-heavy portfolios can leave investors exposed when markets turn. We explore how thoughtful diversification across asset classes may help support long-term outcomes.
The Build Secured Income Fund I (the "Fund") is a continuously offered direct lending private credit fund. The Fund seeks to offer investors modest income and attractive yield by investing in securities-backed, collateralized personal and business loans.i
Our lending partner has a history of thoughtful risk management practices in securities-backed lending. Their platform emphasizes over-collateralization, segregated custody of pledged equities and marketable securities, and disciplined underwriting.
The Fund's future performance may differ materially from its past performance and be subject to various risks noted below and in the Memorandum.
| Year | Jan | Feb | Mar | Apr | May | Jun | Jul | Aug | Sep | Oct | Nov | Dec | FY |
|---|---|---|---|---|---|---|---|---|---|---|---|---|---|
| 2023 | - | - | - | - | - | - | 0.81% | 0.75% | 0.73% | 0.82% | 0.89% | 0.94% | 10.33% |
| 2024 | 0.93% | 0.99% | 0.96% | 0.97% | 0.99% | 0.98% | 0.99% | 0.98% | 0.98% | 0.99% | 0.97% | 1.00% | 12.39% |
| 2025 | 0.93% | 0.92% | 0.91% | 0.91% | 0.90% | 0.93% | 0.91% | 0.89% | 0.83% | 0.81% | 0.87% | 0.82% | 11.17% |
| 2026 | 0.77% | 0.67% | 0.47% | 0.57% | - | - | - | - | - | - | - | - | 7.71% |
| ITD Total Net Returnii,iii,iv | 11.04% |
| Average Loan-to-Valuevi,vii | 38.69% |
| Leverageviii | 0.0x |
| Net Asset Valueix | $30.35MM |
| Underlying Creditsvii | 63 |
| Weighted Average Couponx | 12.45% |
| Average Durationxi | 5.95 months |
| Net Charge-Offsiii | nil |
The Fund's future performance may differ materially from its past performance and be subject to various risks noted below and in the Memorandum.
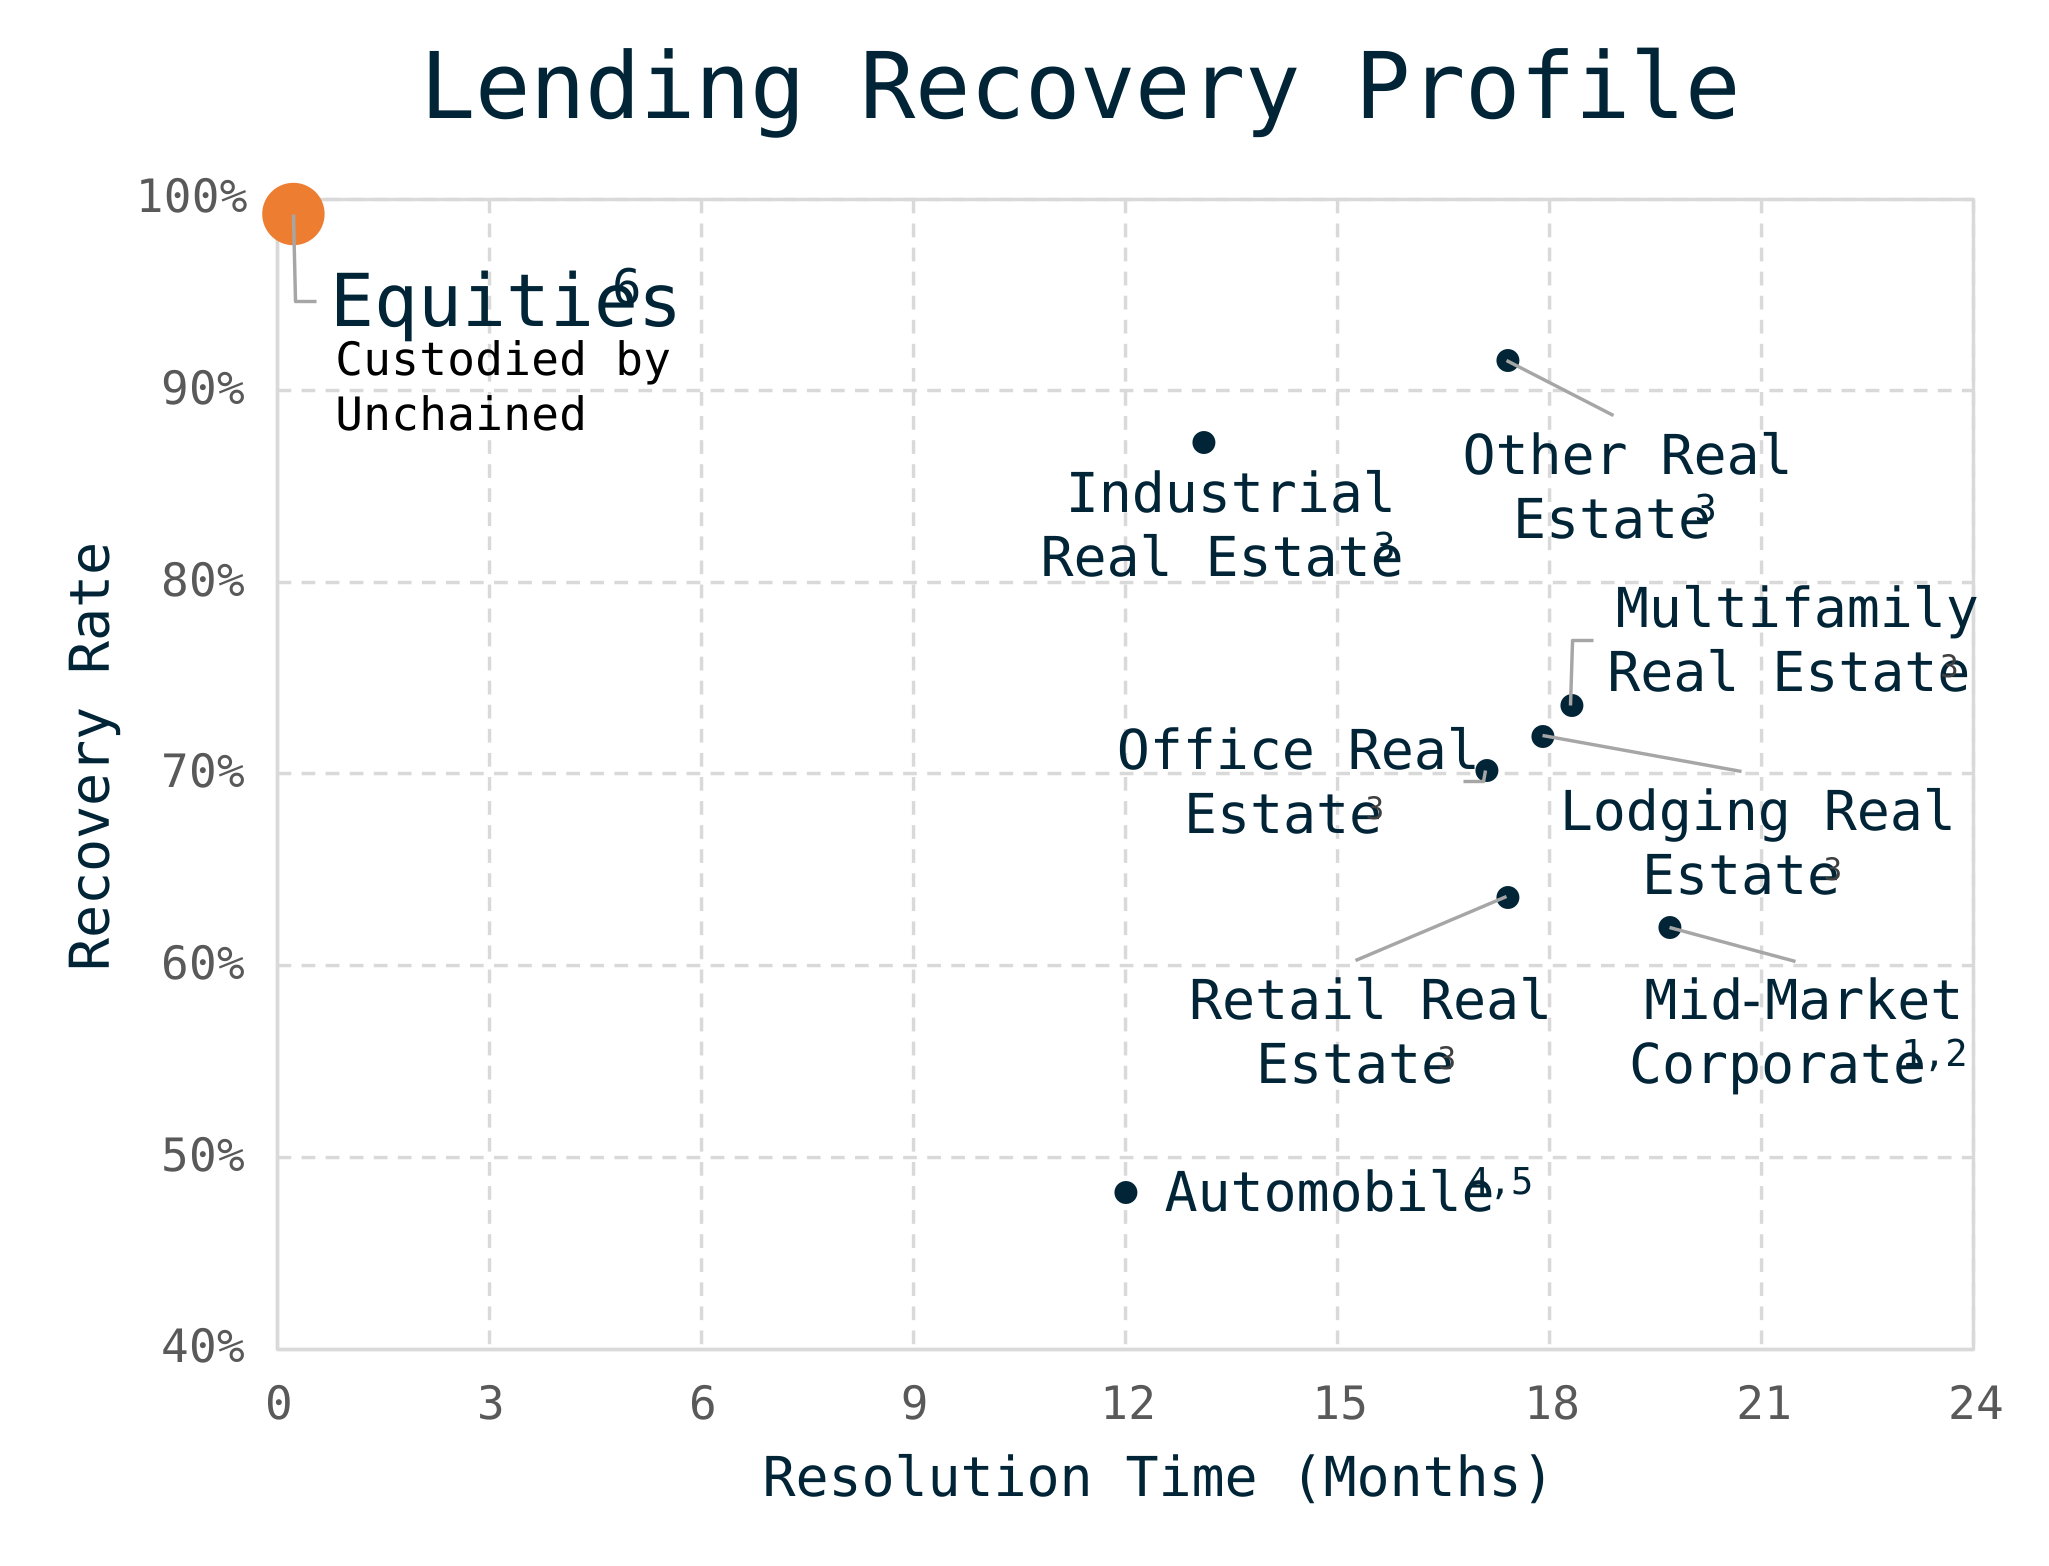
The quality and liquidity of the collateral securing a loan can impact its capability to protect capital in the event of default. We believe faster resolution times and higher recovery rates are critical to maintaining a conservative risk profile.†
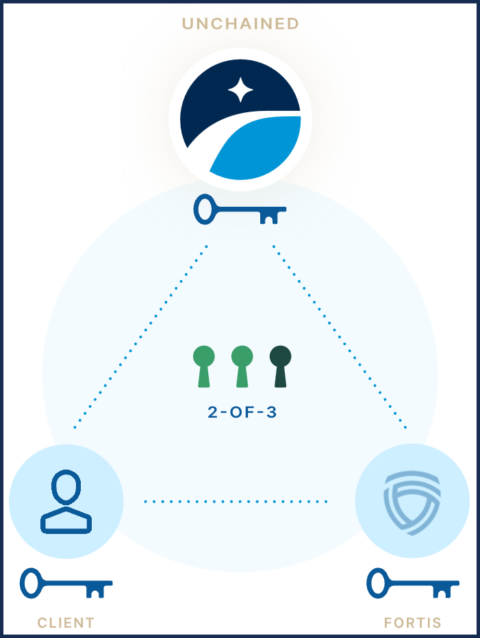
No one person or organization is a single point of failure. Collateral is held through multi-institutional custody, with segregated accounts and dual-control release procedures. Holdings are reconciled daily against custodian statements, making proof of collateral auditable.
10% of management fee proceeds support financial literacy and community initiatives.
Equity-heavy portfolios can leave investors exposed when markets turn. We explore how thoughtful diversification across asset classes may help support long-term outcomes.

Credit and treasury strategies can play a central role in income generation and capital preservation when risk is measured carefully.

When the yield curve steepens, flattens, or inverts, portfolio outcomes can diverge sharply. Duration and income decisions deserve a deliberate framework.

Private market strategies can complement public holdings, but access, liquidity, and underwriting standards matter as much as expected return.
i Loans are collateralized by a Specific Unit of Beneficial Interest (the "SUBI"), a UCC Article 8 Security, issued by UC Secured Assets Trust. The SUBI is backed by publicly traded equities and other marketable securities that the Borrower must deposit into a segregated multi-custodian account. Loans are typically less than one year in duration and have 2x collateral to the borrowed amount. While the manager does not anticipate holding pledged securities because the Servicer is expected to immediately liquidate any securities pledged as collateral for any Loan in the event of Borrower default, the Fund may hold securities for various periods of time. The volume of loans available, the interest rate earned on loans, and the value of the securities backing the loan collateral are all based on public equity and fixed income markets.
ii Returns greater than one year, since inception, or representing FY values are annualized. Any return information provided in this Website has not been audited, and represents the Fund's performance during the periods noted herein, net of related fees and expenses. A full discussion of related fees and expenses can be found in the Memorandum. The Fund's future performance may differ materially from its past performance and be subject to various risks noted below and in the Memorandum.
iii Since inception of fee-paying LPs (July 2023) through April 2026.
iv Calculated using fee-paying LP capital only.
v Distributions are subject to manager discretion. There is no guarantee of any distributions, and the composition of the distributions, if any, may consist of non-cash items, such as return of capital or borrowings.
vi Average Loan-to-Value represents the net ratio of loan-to-value for each loan, weighted based on the fair value of total applicable private debt investments. Loan-to-value is calculated as the current total net debt through each loan divided by the total value of the loan collateral as of the period noted.
vii As of April 2026.
viii Leverage is calculated using the average daily borrowings during the month divided by average net assets.
ix Net Asset Value (NAV) is calculated as total assets (e.g., investments at fair market value, cash, trade receivables and other assets) less total liabilities (e.g., drawn leverage, unsettled trade payables and other liabilities) as determined in accordance with US GAAP.
x Weighted Average Coupon represents the gross ratio of interest rates for each loan, weighted based on the fair value of total applicable private debt investments.
xi Average Duration represents the duration for each loan, weighted based on the fair value of total applicable private debt investments.
xii Measured as the fair market value of investments for each category against the total fair market value of all investments. Totals may not sum due to rounding.
† There is no guarantee these trends will continue in the future. Sources include Moody's and S&P Global historical data and partner historical loan performance (2017 – August 2025).